Spectral Analysis (FFT)
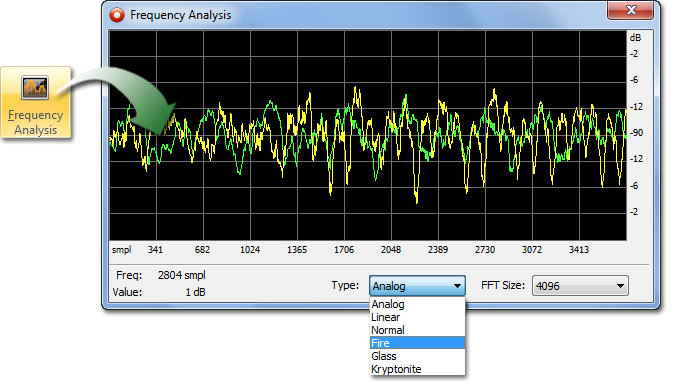
The FFT graph works by taking a small sample of
audio and plotting a graph of frequency (x-axis, in
Hz) versus intensity (y-axis, in dB). The graph features
two different plots if the audio is stereo, otherwise
just the one plot will be displayed. The frequency of
the graph ranges from 0Hz to half the sample rate of
the audio, whilst the intensity range goes from -128dB
to 0dB.